If you are a student, the pie chart is a topic you will surely across in mathematics. For example, those of you in secondary schools know that it always shows up in statistics or related topics in math.
The Pie chart is usually very easy to tackle if you understand the theory behind it.
What I want to show you here are easy steps to understand a pie chart and how to solve/draw it with ease.
What is a pie chart?
Ap pie chart is "a type of graph in which a circle is divided into sectors that each represent a proportion of the whole".
What this grammar is saying is that a circle is used to construct a pie chart. Then the circle is divided into different parts that represent different portions of the total items you want to represent with the pie chart. See Wikipedia.
The examples below will make this even clearer.
How to solve a pie chart math problem
I will show you some examples of how to solve and also draw the Pie chart so you can get a clearer understanding of it.
Pie chart example 1
Imagine a class of 12 students where 6 are males and 6 female. To represent this in a pie chart, it means that half of the circle (pie chart) will be for males while the other half will be for females because there are an equal number of male and female students:
| Students | Number of Students |
| Male | 6 |
| Female | 6 |

Formulas for the pie charts
The example above is easy because we have only two equal values for the pie chart. However and oftentimes, pie charts questions are not made that ridiculously simple.
But no matter the question, there are formulas for solving the pie chart and it is very easy to understand. Here is it.
First of all, let me show you parts of a circle in case you have forgotten. Pay close attention to the sector of the circle.
Parts of a circle

There are usually three easy ways to think about pie chart problems, those 3 methods are:
- angle
- percentage
- ratio
Angle: The angle in a complete circle is 360o. So a pie chart has a total of 360o. Working with angles make things easy because we need to know the angle before we can draw the sector.
Now to solve example 1 using angles, you can say:
Total number of students = 12,
Males = 6,
Females = 6
Then to determine the size of the sector of the circle that should represent the female students, we can say:
360o = 12
x = 6
x = (360 * 6) ÷ 12 = 180.
x = 180o
It means that the sector for females will take 180o and that for males will take the rest. This is what we have in example 1 above.
Percentage: The complete circle for the pie chart means 100% of the pie chart. So in the example above it means there are 50% female and 50% male students.
Ratio: This is basically the same as the percentage of angles. In example 1 we can say that 6/12 are female students.
Remember to study Past Questions and Answers for Free at EduPadi Classroom.
Pie chart example 2
What if we don't have an equal number of students in the classroom?
In this example, let's assume there are 7 female students and 5 male students. Then, it means that the female students will be represented with a larger portion of the pie chart.
But we have to calculate the sectors first using any of the methods above. Let me think in terms of angles:
Total number of students = 12,
Males = 5,
Females = 7
Then to determine the size of the sector of the circle that should represent the female students, we can say:
360o = 12
xo = 7
x = (360 * 7) ÷ 12 = 210.
x = 210o
It means that the sector for females will take 210o and the males will take what is left (that is 360 - 210 = 150o).
Represent this in a pie chart:
| Students | Number of Students |
| Male | 5 |
| Female | 7 |

Pie chart example 3
Now let's work with more than 2 sectors.
Question: A pie chart has 3 sectors representing the staff of a bank. If there are 10 executives representing 20% of total staff, and there are 20 junior staff representing 40%, and the rest are interns,
a. how many are interns?
b. draw a pie chart to represent the data
Solution
a.
executives + junior = 20% + 40%
10 + 20 = 60%
30 = 60%
interns percentage:
100% - 60% = 40%
number of interns:
30 = 60%
x = 40%
x = (30 * 40) / 60 = 20.
Hence, there are 20 interns.
Calculate the sectors for the pie chart
Executives sector:
20 % of 360o = (20/100) * 360 = 72o
Junior staff sector:
40 % of 360o = (40/100) * 360 = 144o
Interns sector:
360o 72o - 144o = 144o
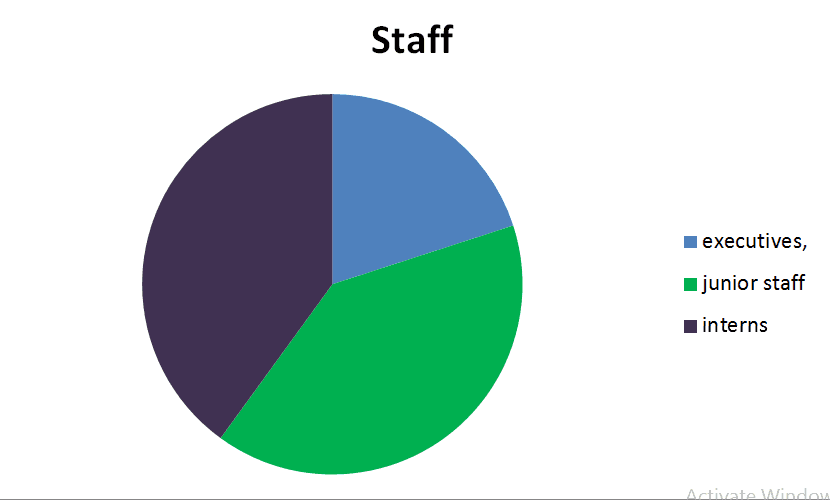
Drwawing the pie chart
| Rank | Staff |
| executives, | 10 |
| junior staff | 20 |
| interns | 20 |

Learn by doing it yourself!
Question: A class has 90 students. 30 like physics, 45 like math, others like economics.
a. how many students like economics?
b. draw a pie chart to represent the data
You can post your answer in the comment box below.