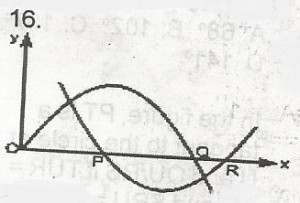
Question on: JAMB Mathematics - 1993

A
1, 3, 2
B
0, 0, 0
C
0, 2, 3
D
1, 2, 3
Ask EduPadi AI for a detailed answer
Correct Option: D
The two equations are y = x(2 - x) and y = (x - 1)(x - 3)
The root of these equations are points where the graph of the equations cuts the x axis; but at these points = 0
put y = 0; 0 = x(2 - x)
0 = (x - 1)(x - 3)
x = 0 or x = 2; x = 1 or x = 3
The values of x at P, Q, R are increasing towards the positive direction of x-axis
at P, x = 1 at Q, x = 2 at R, x = 3
P, Q, R are respectively (1, 2, 3)
Add your answer
Please share this, thanks!
No responses