Question on: JAMB Mathematics - 2001

A
\(\frac{1}{5}\)
B
\(\frac{2}{25}\)
C
\(\frac{4}{15}\)
D
\(\frac{3}{25}\)
Ask EduPadi AI for a detailed answer
Correct Option: D
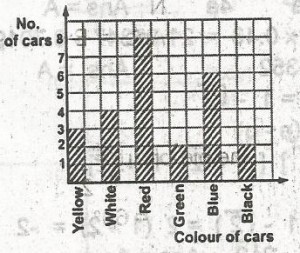
\(\begin{array}{c|c} \text{colour of cars} & \text{Number (frequency)} \ \hline yellow & 3 \white & 4\ red & 8\ green & 2\ blue & 6\ black & 2\ \hline & 25 \ \hline\end{array}\)
Thus, the fraction of the total numbers that are yellow is \(\frac{3}{25}\)
Thus, the fraction of the total numbers that are yellow is \(\frac{3}{25}\)
Add your answer
Please share this, thanks!
No responses