Question on: JAMB Mathematics - 2003
A
15
B
18
C
20
D
21
Ask EduPadi AI for a detailed answer
Correct Option: C
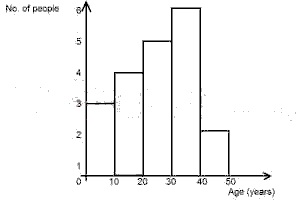
| age | People |
| 10 | 3 |
| 20 | 4 |
| 30 | 5 |
| 40 | 6 |
| 50 | 2 |
| 20 |
Add your answer
Please share this, thanks!
No responses
Score High in JAMB With EduPadi CBT App
Practice JAMB CBT, get instant results, and understand solutions in-depth with smart AI insights.
| age | People |
| 10 | 3 |
| 20 | 4 |
| 30 | 5 |
| 40 | 6 |
| 50 | 2 |
| 20 |
Please share this, thanks!
No responses
Learn real coding skills with Arinze Anakor — join him at zestmade.com and connect with him on X (formerly Twitter) for hands-on coding classes and practical learning.