Question on: JAMB Mathematics - 2001
A
17
B
16
C
15
D
14
Ask EduPadi AI for a detailed answer
Correct Option: A
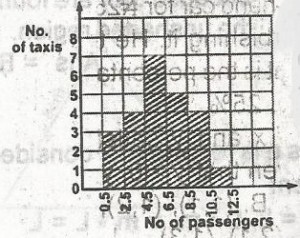
\(\begin{array}{c|c} \text{no. of passengers} & \text{Number of taxis}\ \hline 0.5 - 2.5 & 3\ 2.5 - 4.5 & 4 \ 4.5 - 6.5 & 7\ 6.5 - 8.5 & 5\ 8.5 - 10.5 & 4 \ 10.5 - 12.5 & 1\ \hline \text{Total} & 24 \end{array}\)
Thus, the taxi with more than 4 passengers
= 7 + 5 + 4 + 1 = 17
Thus, the taxi with more than 4 passengers
= 7 + 5 + 4 + 1 = 17
Add your answer
Please share this, thanks!
No responses