Question on: JAMB Mathematics - 2013

A
30
B
11
C
50
D
20
Ask EduPadi AI for a detailed answer
Correct Option: B
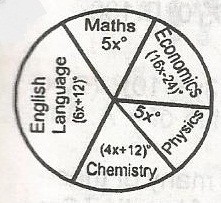
5xo + (16x - 24)o + 5xo + (4x + 12)o + (6x + 12)o = 360o
360xo - 24 + 12 + 12 = 360o
36xo = 360o
xo = \(\frac{360^0}{36}\)
= 10o
Thus, the angle of sector representing Mathematics is 5 x 10o = 50o. Hence the number of students who offer mathematics is
\(\frac{55^o}{36} \times 80 \approx 11\)
360xo - 24 + 12 + 12 = 360o
36xo = 360o
xo = \(\frac{360^0}{36}\)
= 10o
Thus, the angle of sector representing Mathematics is 5 x 10o = 50o. Hence the number of students who offer mathematics is
\(\frac{55^o}{36} \times 80 \approx 11\)
Add your answer
Please share this, thanks!
No responses