Question on: SS1 Mathematics - Data Presentation And Statistics
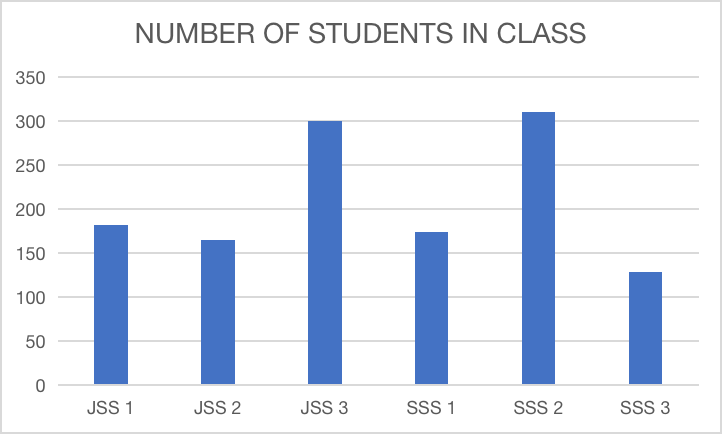
The table below gives the number of students in each class in a secondary school in Port Harcourt. Construct a bar chart and pie chart with the data.
|
YEAR OF STUDY |
NUMBER OF STUDENTS |
|
JSS 1 |
182 |
|
JSS 2 |
165 |
|
JSS 3 |
300 |
|
SSS 1 |
174 |
|
SSS 2 |
310 |
|
SSS 3 |
128 |
View related lesson
Ask EduPadi AI for a detailed answer

Add your answer
Please share this, thanks!
No responses