1994 - JAMB Mathematics Past Questions and Answers - page 5
41
A
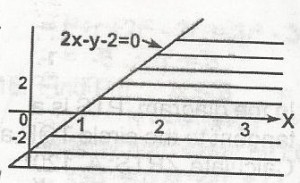
2x - y - 2 \(\geq\) 0
B
2x - y - 2 \(\leq\) 0
C
2x - y - 2 < 0
D
2x - y - 2 > 0
42
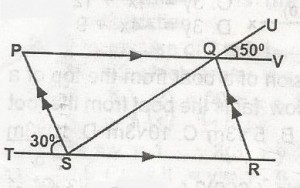
A
30o
B
50o
C
80o
D
100o
43
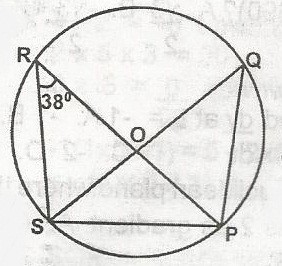
A
148o
B
104o
C
80o
D
52o
44
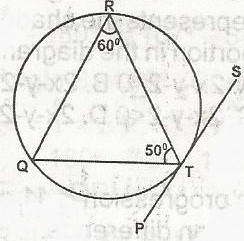
A
120o
B
70o
C
60o
D
40o
45
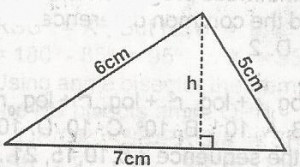
A
\(\frac{12}{7}\)cm
B
\(\frac{12}{7} \sqrt{6}\)cm
C
\(\frac{7}{12}\)cm
D
\(\frac{1}{2}\)cm
46
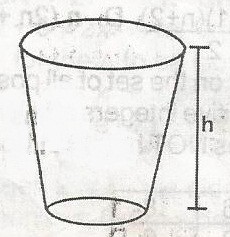
A
2h
B
2\(\pi\)h
C
\(\pi\)h
D
\(\frac{\pi h}{2}\)
47
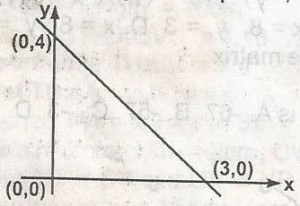
A
3y = 4x + 12
B
3y = 3x + 12
C
3y = -4x + 12
D
3y = -4x + 9
48
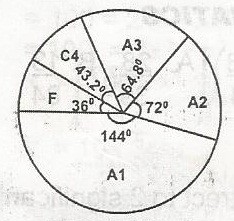
A
52.0
B
43.2
C
40.0
D
12.0
Loading lesson…